Use the Debugger!
[Update 23 Feb 2011: Click here for a video tutorial of the debugger in Macro Scheduler 12]
The first thing I turn to when helping someone get their script working is the debugger. But I’m often surprised to hear people say they didn’t know about the debugger. The debugger is an invaluable tool to help you find problems in scripts and is dead easy to use.

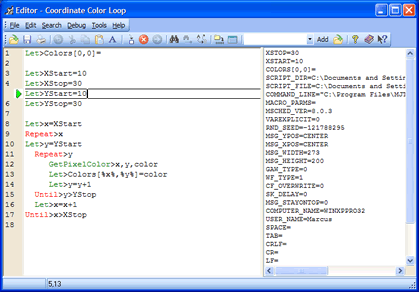
Here’s how to use it. Open your script in the script editor. You’ll want to enable the watch list. This shows you the value of script variables and updates them as they change. Select “Show Watch List” from the “Debug” menu. This displays the watch list on the right of the editor, as can be seen in the picture above.
Step Through Line by Line. Place the cursor on the first line of the script and hit F8. F8 executes the current line and then stops and waits for you to press F8 again. This allows you to “step” through the script one line at a time. You’ll see the green arrow next to the current line and a border around it. You can now follow the flow of execution through the script at your own pace. Every time a variable is created you’ll see it appear in the watch list and when a variable value changes you’ll see the new value there.
Breakpoints. Note that F8 executes the current line so in most cases when you start debugging you’ll want to put the cursor on the first line. Sometimes you may just want to debug a part of the script so you can start at that point. That’s fine as long as the code before that point doesn’t set things up that are required to make the bit you want to debug work, such as initialising variables. If that is the case you can set a “breakpoint” just before the bit you want to step through and then run from the top. To set a breakpoint, put the cursor on the line where you want the breakpoint to be and select Debug/Insert Breakpoint. Now place the cursor on the first line and select Debug/Run. The macro will now run as normal but stop when it reaches the breakpoint and wait for you to step onwards using F8.
The Watch List is a very important tool in tracking down why values aren’t what you think they should be or why certain outcomes that depend on variable values take place. With the watch list you can see when a value changes and what line caused it to change. This is extremely helpful and can highlight scripting errors and bad logic.
Side Effects of Debugging. One thing to bear in mind is that the act of debugging slows execution down, since the script waits for you to execute each line. If a script is failing because it is running too fast and doesn’t have sufficient code to ensure the system is ready for each step (e.g. a lack of WaitWindowOpen commands) then you will probably find that when you debug the script it works! So here’s a tip: if the script works when you debug it but doesn’t when you run it, the problem is almost certainly a timing issue and you need more intelligent delays.
So if you have a script which does something unexpected at a certain point and isn’t working how you want it to, or throws up a weird error and you’re not sure which part of the script is the problem then use the debugger. You’ll then find out which bit of the script is the problem and can step through it to find out what the cause is.
[Update: In version 9.0 the debugger is part of the Advanced Editor. From Macro Properties click the “Advanced Editor” button.]